
Vol. 1, No. 1, 2023, pp. 10-15
ISSN 3030-9174
https://e-journal.ptti.info/index.php/ijase
Analysis of Ascorbic Acid Content in Pineapples and Melons Using the UV-Vis Spectrophotometry Method
1 nensiulfatun98@gmail.com; 2 riyanto@gmail.com
* Corresponding Author
Article history Received September 01, 2023
Revised October 07, 2023
Accepted November 08, 2023
Samples of Pineapple;
Melon;
UV-Vis Spectrophotometry
Research on the analysis of ascorbic acid content in pineapples and melons has been carried out using the UV-Vis spectrophotometry method. This study aims to determine the levels of ascorbic acid in pineapple and melon. The samples used in this study were pineapple samples and melon samples. The ascorbic acid concentrations were measured for the two samples. The measurements were carried out using the UV-Vis spectrophotometry method at a wavelength of 265 nm. To determine whether there is a difference in the concentration of ascorbic acid between the pineapple and melon samples. After the research that has been done it turns out that the dilution shows different concentrations that have been obtained. Based on the measurement results using UV-Vis spectrophotometry, it was found that the ascorbic acid concentration contained in the pineapple sample was 163.82 mg/L, while the ascorbic acid concentration contained in the melon sample was 45.35 mg/L. So the result is higher than pineapple fruit compared to melon fruit.

1.Introduction
The compound ascorbic acid (Vitamin C) has many functions, including a role in the biosynthesis of collagen, norepiperin, peptide hormones and tyrosine [1]. One source of ascorbic acid is fruit, including pineapple, melon, orange, manga, guava, apple, etc. In addition to fruits, ascorbic acid is also contained in vegetables such as tomatoes, broccoli, parsley, pepperoni, cabbage and others [3].
Vitamin C (ascorbic acid) is a vitamin that is really needed by the body and has the function of increasing the body's energy. Vitamin C can be obtained from food, generally found in vegetables and fruit [2]. One of the fruits that contain vitamin C is melon and pineapple. Melon is a fruit that is rich in broad benefits. Fresh melon contains approximately 90% water, which is good for digestion because of its high fiber content. Besides that, melons also contain vitamin C which can prevent canker sores, smooth the skin, increase body resistance and act as antioxidants. Melon fruit is generally consumed as fresh fruit to wash the mouth or quench thirst. Besides that, melons are used as a mixture of drinks or made of juice, even today melons are starting to be used as a mixture of drinks or fruit juices [2]. Different varieties of melon affect skin color (green and orange), skin texture (amount of fiber, flesh color (green to orange), flesh texture, and fruit shape (fruit and oval), as well as the nutritional content contained in the fruit [5].
Pineapple is a type of fruit that is much sought after by the public. The shape is elliptical, the skin of the fruit is scaly. The recommended requirement for vitamin C is 30-60 mg per day, while the average adequacy of vitamin C for families is 53.7 mg. Important sources of vitamin C in food mainly come from fruits and vegetables. In a source of vitamin C, the higher levels of vitamin C are in the skin compared to the flesh and the part of the fruit that contains the least vitamin C is the seeds [4].
There are several methods used in vitamin C analysis, one of which is the UV-Vis Spectrophotometry method. UV-Vis spectrophotometry can be used for both qualitative and quantitative analysis. Analysis of Vitamin C is used to identify the medicinal quality or metabolites of the fruit. Therefore, a simple, fast, economical, and practical analytical method is needed. Thus, the method used in this research is to use the UV-Vis Spectrophotometry method. Therefore, in this research, "Analysis of Ascorbic Acid Content in Pineapples and Melons Using the UV-Vis Spectrophotometric Method."
2.Method
2.1.Material
Pineapple samples, melon samples, Ascorbic Acid brand code 1.00468.0250, Aquades, Filter Paper.
2.2.Tool
Analytical Balance, Blender, Knife, 250 mL Beaker, 50 mL Beaker, Separating Funnel, Stirrer, 500 mL Measuring Flask, 100 mL Measuring Flask, 50 mL Flask, Spray Bottle, Watch Glass, Spatula, UV-Vis Double Spectrophotometry Beam.
2.3.Work Procedures
2.3.1.Preparation of 100 ppm Ascorbic Acid Mains Solution
Ascorbic acid was weighed as much as 50 mg. Put it in a beaker, then add about 50 mL of distilled water, then stir until the solution dissolves, then put it in a 500 mL volumetric flask. Dissolved with distilled water up to the mark.
2.3.2.Maximum Wavelength Determination
Pipette 5 mL of 100 ppm ascorbic acid solution and put it into a 50 mL volumetric flask (with a concentration of 10 ppm). Distilled water was added until the limit mark, then the absorbance of the solution was measured using UV-Vis Spectrophotometry in a wavelength of 200 nm to 400 nm.
2.3.3.Determination of Calibration Curve
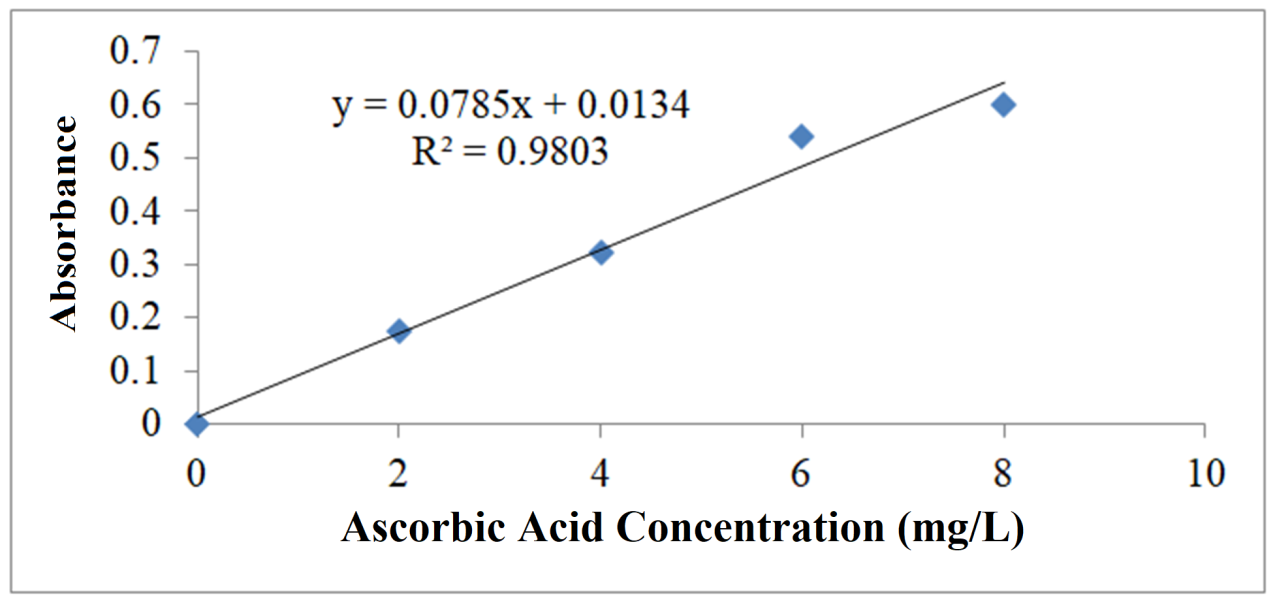
The 100 ppm ascorbic acid stock solution was taken in 2 mL, 4 mL, 6 mL, 8 mL (4 ppm, 6 ppm, 12 ppm, 16 ppm) respectively into a 50 mL measuring flask (Table 1). Then add distilled water up to the mark, then shake. The absorbance of the standard solution series was then measured using UV-Vis Spectrophotometry at a predetermined maximum wavelength.
| No | Ascorbic Acid Concentration (mg/L) | Absorbance (average) |
|---|---|---|
| 1 | 0 | 0.000 |
| 2 | 2 | 0.173 |
| 3 | 4 | 0.322 |
| 4 | 6 | 0.540 |
| 5 | 8 | 0.601 |
2.3.4.Determination of Ascorbic Acid Levels in Pineapple and Melon Fruit Samples
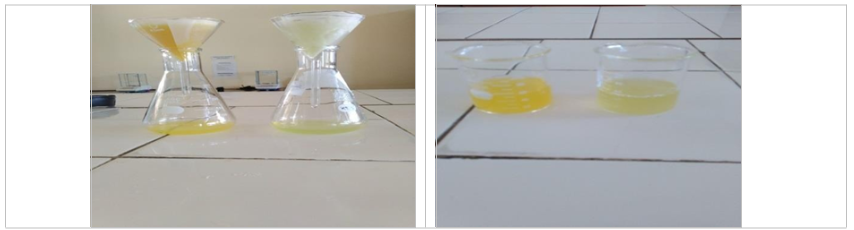
Pineapple and melon fruit samples were peeled and washed clean. Then cut into small pieces and weighed 5 grams. After that, blend it and take the solution. Then filtered with filter paper. Then pipetted from each fruit 1 mL. Place in a 100 mL measuring flask (Table 2). Then added distilled water up to the boundary mark and homogenized. The absorbance was measured by UV-Vis spectrophotometry at the maximum wavelength obtained (Fig. 1).
2.4.Observation Data
| No | Sample Name | Absorbance | C regression (mg/L) | Dilution | Ascorbic Acid Concentration (mg/L) |
|---|---|---|---|---|---|
| 1 | Pineapple | 0.142 | 1.6382 | 100 | 163.82 |
| 2 | Pineapple | 0.142 | 1.6382 | 100 | 163.82 |
| 3 | Pineapple | 0.142 | 1.6382 | 100 | 16382 |
| 4 | Melon | 0.049 | 0.4535 | 100 | 45.35 |
| 5 | Melon | 0.049 | 0.4535 | 100 | 45.35 |
| 6 | Melon | 0.049 | 0.4535 | 100 | 45.35 |
2.5.Calculation
2.5.1.Pineapple Juice Regression Concentration
2.5.2.Concentration of Ascorbic Acid in 1L of Pineapple Juice
2.5.3.Melon Juice Regression Concentration
2.5.4.Ascorbic Acid Concentration in 1L Melon Juice
3.Results and Discussion
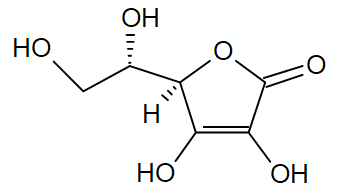
This research was carried out to analyze the ascorbic acid content in pineapples and melons using the double beam UV-Vis spectrophotometry method. The test that has been carried out is the ascorbic acid content in pineapples and melons which aims to determine the levels of pineapples and melons that contain ascorbic acid. Ascorbic acid, which has the molecular formula C6H8O6 (Fig. 2), plays an important role in the body, even though the absorption rate in the small intestine is only a few percent, because too much of it will cause cancer or be toxic. First, before analysis, the pineapple is peeled, the seeds removed, washed, then cut into small pieces and blended until smooth like juice. Then squeeze it like squeezing grated coconut from a pineapple blender using a 200 mesh sieve so that there is a good juice solution. After that, it is filtered using filter paper, then 1 mL is taken and placed in a 100 mL measuring flask for dilution to the limit mark and shaken until homogeneous. The treatment is the same for melons as the destruction of pineapples. Based on the results of filtering samples of pineapple and melon with the filter paper shown in Fig. 3.
Before analyzing pineapple and melon samples containing ascorbic acid, first make a 100 ppm ascorbic acid stock solution, by taking 50 mL to determine the maximum wavelength. Then the absorbance of the solution was measured using UV-Vis spectrophotometry in the wavelength range 200 nm to 400 nm, determining the maximum wavelength of ascorbic acid. Based on the results of absorbance measurements in the range 200-400 nm, the maximum absorbance was obtained at a wavelength of 265 nm with an absorbance of 0.9791. Therefore, the next measurement was to measure the standard solution of ascorbic acid from each standard solution of 100 ppm ascorbic acid, take 0 mL, 2 mL, 4 mL, and 6 mL, 8 mL from a 50 mL volumetric flask and add distilled water from each-each volumetric flask obtains 0.000 nm; 0.173nm; 0.322nm; 0.540nm; 0.601nm. So the higher the volume (2 mL, 4 mL, 6 mL) used in the standard Ascorbic Acid solution, the higher the concentration (4 ppm, 8 ppm, 12 ppm).
The measurement results for the standard solution obtained the calibration curve shown in Fig. 4. Based on the curve, the linear regression equation for ascorbic acid is y = 0.0785x + 0.0134 with an R2 value of 0.9803.
This was then carried out on samples of Pineapple and Melon that had been destroyed, then measured using a UV-Vis spectrometer. Based on the results of measuring the concentration of Ascorbic Acid in 3 Pineapple Samples with a volume of 100 mL extract of the pineapple sample obtaining an absorbance of 0.142 nm in C regression, the same results were obtained between each pineapple sample 1, pineapple sample 2, and pineapple sample 3 obtained a regression C of 1.6382 mg/L with the results of measuring the concentration of ascorbic acid in the pineapple sample, the 3 samples obtained the same concentration of 163.82 mg/L. As for the results of measuring the concentration of ascorbic acid in the melon fruit sample with a volume of 100 mL of melon fruit extract, the absorbance of 0.049 nm in C regression obtained the same results between each melon sample 1. Melon sample 2 and melon fruit sample. 3 obtained C regression of 0.4535 mg/L with the results of measuring the concentration of ascorbic acid in the melon fruit sample, all three samples obtained the same concentration of 45.35 mg/L (Table 3).
| No | Sample Name | Absorbance | C regression (mg/L) | Dilution | Ascorbic Acid Concentration (mg/L) |
|---|---|---|---|---|---|
| 1 | Pineapple | 0.142 | 1.6382 | 100 | 163.82 |
| 2 | Pineapple | 0.142 | 1.6382 | 100 | 163.82 |
| 3 | Pineapple | 0.142 | 1.6382 | 100 | 163.82 |
| 4 | Melon | 0.049 | 0.4535 | 100 | 45.35 |
| 5 | Melon | 0.049 | 0.4535 | 100 | 45.35 |
| 6 | Melon | 0.049 | 0.4535 | 100 | 45.35 |
4.Conclusion
Based on the data obtained during the research, it can be concluded that the Ascorbic Acid content in pineapples and melons, the highest absorbance was in the pineapple fruit samples which had an absorbance obtained of 0.142 nm. Meanwhile, the melon fruit sample had an absorbance of 0.049. In the C regression, the pineapple fruit sample had a C regression of 1.6382 mg/L, while the melon sample had a C regression of 0.4535 mg/L. So the concentration of ascorbic acid in the pineapple sample was 163.82 mg/L, while in the melon sample it was 45.35 mg/L.
Author Contribution: All authors contributed equally to the main contributor to this paper. All authors have read and agreed to the published version of the manuscript.
Funding: This research received no external funding.
Conflicts of Interest: The authors declare no conflict of interest.