
Vol. 3, No. 2, 2025, pp. 9-27
ISSN 3030-9174
https://e-journal.ptti.info/index.php/ijase
Questioning "Boy Math" and "Girl Math": A Measurement-Based Test of Gendered Financial Behaviour Profiles Among Indonesian Students
b Department of Educational Mathematics, Universitas Negeri Yogyakarta, Yogyakarta, 55281, Indonesia
c Department of Electrical Engineering, Universitas Negeri Yogyakarta, Yogyakarta, 55281, Indonesia
d Department of Pedagogy and Psychology, Abai Kazakh National Pedagogical University, Almaty, 050010, Kazakhtan
e Department of Art Education, Helwan University, Cairo, 4034572, Egypt
f Department of Monitoring and Evaluation, The Open University of Tanzania, Dar es Salaam, 23409, Tanzania
1 asmakhoirunnisa.2025@student.uny.ac.id; 2 heri_retnawati@uny.ac.id; 3 riskysetiawan@uny.ac.id; 4 samsul_hd@uny.ac.id;
5 hanifahmaratush.2025@student.uny.ac.id; 6 jan_27_2001@mail.ru; 7 alaaeltlwany@gmail.com; 8 ayshamussa22@gmail.com
* Corresponding Author
Article history Received June 02, 2026
Revised July 14, 2026
Accepted August 18, 2026
Gender Differences;
Measurement Invariance;
K-Means Clustering;
Explainable Machine Learning
The popular phrases "Boy Math" and "Girl Math" have transformed humorous spending explanations into a wider discussion about gender and money. This study uses the discourse as a cultural entry point rather than as a construct directly measured by PISA 2018, which predates the trend and does not assess meme-specific post-hoc spending rationalisations. Using complete-case data from 5,833 Indonesian students, the study examined financial autonomy, careful price behaviour, bank confidence, digital confidence, financial behaviour, and financial attitude through ordinal confirmatory factor analysis, gender measurement invariance, latent factor scores, k-means clustering, and a secondary Random Forest diagnostic. The measurement model showed acceptable fit (CFI = 0.992, TLI = 0.991, RMSEA = 0.063, SRMR = 0.059), and invariance was supported up to the strict level. The two-cluster solution separated students consistently across all six dimensions, indicating higher and lower financial engagement levels rather than qualitatively distinct reasoning styles. The unadjusted association between gender and cluster membership was not significant, χ²(1) = 2.135, p = 0.144, Cramer's V = 0.019. In adjusted logistic regression using conventional standard errors, male students had slightly lower odds of belonging to the higher-engagement group after grade was controlled (OR = 0.864, p = 0.006). School-clustered standard errors were not reported in the supplied output, so the adjusted inferential result remains provisional. Given the gender-balanced profiles, negligible unadjusted effect size, and odds ratio close to one, the relationship is substantively small. Random Forest reconstructed the internally generated cluster labels with 97.27% out-of-bag accuracy; this represents classification fidelity rather than external predictive validity. The findings do not support treating "Boy Math" and "Girl Math" as clear empirical gender categories.

1.Introduction
Financial literacy is an important competence for young people because financial decisions now begin before adulthood and often happen in digital settings. Students are already exposed to saving, spending, online transactions, mobile payments, family money rules, peer consumption, digital banking, and commercial persuasion before they enter work. International assessment reports also show that financial literacy remains a policy priority because 15-year-old students need to understand money, compare options, and manage financial risks in daily life [1][2][3][4][5]. In Indonesia, this issue is also important because the 2024 National Survey on Financial Literacy and Inclusion reported a financial literacy index of 65.43 percent and a financial inclusion index of 75.02 percent [6]. These figures show progress, but they also show that access to financial products does not always mean students have strong financial understanding or responsible financial behaviour. For adolescents, financial learning comes from many sources, including school, family, peers, social media, and digital platforms.
The PISA financial literacy framework is useful for studying adolescent financial behaviour because it does not treat financial literacy only as arithmetic or knowledge of financial terms. It includes knowledge and understanding, financial processes, money and transactions, planning and managing finances, risk and reward, and the financial landscape [1][2][7][8]. The questionnaire also measures financial independence, banking confidence, digital financial confidence, consumer behaviour, financial practices, and attitudes toward money [6]. This is important because students may understand financial concepts but still have low confidence, weak monitoring habits, or impulsive spending behaviour. Recent studies also show that financial literacy research has moved from knowledge-only models to broader models that include knowledge, confidence, behaviour, attitude, inclusion, and well-being [9][10][11][12][13][14][15][16][17][18]. Therefore, adolescent financial literacy should not only be studied by asking whether boys or girls score higher. It should also examine how different financial behaviour dimensions form meaningful profiles.
Contemporary online discourse has increasingly framed spending decisions through gendered narratives, including labels such as "Boy Math" and "Girl Math," which humorously describe how individuals justify spending, saving, shopping, or perceiving certain costs as less financially burdensome. However, these labels do not constitute established scientific constructs and should not be treated as literal behavioural categories, as doing so may produce weak conclusions and reinforce gender stereotypes. Moreover, the PISA 2018 Financial Literacy Questionnaire predates the emergence of these narratives and was not designed to measure such context-specific financial rationalisations. Therefore, the present study uses these terms only as a cultural framing device to examine whether gender is associated with broader latent financial behaviour profiles. This approach is consistent with the wider literature, which shows that gender differences in financial literacy are complex and may appear in confidence, self-assessment, investment attitudes, and non-response patterns, while international school-based assessments often report small or inconsistent differences in average financial literacy performance [9][16][17][18][19][20][21][22][23][24]. More recent studies involving high-school students, Generation Z, and digital financial literacy further indicate that the relationship between gender and financial behaviour may interact with financial education, parental discussion, digital access, socio-economic background, and individual confidence [9][21][22][23][24][25][26][27][28][29][30]. Thus, culturally constructed gender narratives may shape public perceptions of financial behaviour without necessarily representing stable psychological or behavioural types.
This creates the main research problem. If gender is compared only using raw mean scores, the issue of "Boy Math" and "Girl Math" can appear too simple. In fact, financial behaviour is latent, multidimensional, and measured using ordinal and binary questionnaire items. Mean scores are easy to calculate, but they assume that all items have equal weight and that response categories have equal distances. For non-cognitive instruments, this assumption can be too strong. Psychometric studies recommend modelling ordinal indicators more carefully when researchers want to interpret latent traits rather than only summarize item responses [31][32][33][34][35][36][37][38][39]. Therefore, this study treats selected questionnaire blocks as indicators of latent financial behaviour constructs and uses latent factor scores as the main input for machine learning profiling. This approach keeps the value of the questionnaire while reducing the risk of over-interpreting raw averages.
The proposed solution is to separate profile formation from gender interpretation. First, financial behaviour profiles are identified using latent factor scores estimated through ordinal confirmatory factor analysis. Second, measurement invariance is tested to check whether the latent structure works similarly for female and male students. Third, clustering is conducted without gender as an input variable, so the profiles are based on behavioural and attitudinal patterns rather than sex labels. Fourth, gender is examined after the profiles are created using profile distribution, chi-square association, effect size, and regression analysis. Fifth, Random Forest is used as an explainable machine learning method to identify which latent dimensions most strongly reproduce profile membership. This design follows recent recommendations in educational data science that machine learning should reveal patterns while still maintaining measurement validity and interpretability [40][41][42][43][44][45][46][47][48].
The current literature shows several related research streams. The first stream studies financial literacy among students using PISA, national surveys, or school-based questionnaires [3][7][8][27][29]. The second stream examines gender gaps, confidence gaps, stereotype threat, and differences between knowledge and self-perception [16][17][18][20][21]. The third stream focuses on digital financial literacy and behavioural finance in relation to mobile banking, online payments, and financial technology [10][12]. The fourth stream applies psychometric models such as confirmatory factor analysis, measurement invariance, item response theory, and cognitive diagnostic modelling in educational assessment [31][32][33]. The fifth stream uses machine learning, clustering, Random Forest, SHAP, and educational analytics to study patterns in student data [49][50][51][52].
The novelty of this study is that it connects those research streams through a gender-sensitive and measurement-based design. Rather than claiming to measure the "Boy Math" and "Girl Math" phenomenon directly, this study evaluates whether the broader financial behaviour dimensions associated with money confidence, autonomy, attitudes, and consumer practices form identifiable profiles and whether those profiles differ by gender. This distinction positions the study as an empirical examination of financial behaviour patterns inspired by a cultural discourse, rather than a validation of the discourse itself.
2.Method
2.1.Research Design
This study used a quantitative secondary data design based on the PISA 2018 Financial Literacy Questionnaire. The unit of analysis was the student, and the analytic focus was the Indonesian sample. The design was non-experimental because the study did not manipulate instructional conditions or assign students to treatments. Instead, it used existing large-scale assessment data to examine latent financial behaviour dimensions and to identify machine learning-based student profiles. This design is appropriate because the purpose of the study was not to estimate a causal treatment effect, but to produce a measurement-informed profile of students' financial behaviour and to examine whether gender was associated with that profile membership after the profiles had been created.
The methodological design was built around a key principle: gender should not be used to create the profiles. This principle was adopted to avoid circular interpretation. If gender were used as an input variable during clustering, any later statement about gender differences across clusters would be partly built into the cluster solution itself. Therefore, the clustering stage used only latent financial behaviour scores. Gender was introduced afterward as an external grouping variable. This allows the study to ask whether female and male students are distributed differently across profiles without defining the profiles as male or female categories.
2.2.Data & Variables
The original PISA financial literacy questionnaire dataset contained 107,174 students and 1,058 variables. The analysis selected Indonesian students using the country code IDN. The selected Indonesian dataset contained 7,133 students and 37 variables before complete-case filtering. The variables included student identifiers, school identifiers, stratum, grade, gender, and selected financial literacy questionnaire items. After removing cases with missing values on the variables used in the modelling pipeline, the final complete-case analytic sample contained 5,833 students, consisting of 3,032 female students and 2,801 male students. Because the present article focuses on an analytic modelling pipeline, official PISA student weights and replicate weights were not applied. The results should therefore be interpreted as analytic evidence from the selected complete cases, not as official population estimates for Indonesia.
The selected questionnaire blocks were FL159, FL160, FL162, FL163, FL168, and FL169 (see Table 1). These blocks were chosen because they are directly related to financial independence, consumer behaviour, bank confidence, digital financial confidence, actual financial behaviour, and financial attitude. FL159 items were used to represent financial autonomy. FL160 items were used to represent careful price behaviour, with one item also indicating impulsive spending. FL162 measured confidence in bank-related activities, such as understanding bank statements and managing bank accounts. FL163 measured confidence in digital financial activities. FL168 contained binary behavioural indicators, such as checking change, using digital payments, and monitoring money. FL169 measured attitudes toward money matters. This selection allowed the study to focus on non-cognitive financial behaviour profiles rather than cognitive financial literacy test performance.
| Construct | Code | Substantive meaning | Response format |
|---|---|---|---|
| Financial autonomy | FL159Q01HA–FL159Q04HA | Independence and permission in money decisions | Ordinal |
| Careful price behaviour | FL160Q01HA–FL160Q04HA | Comparison, waiting, and cautious consumption | Ordinal |
| Bank confidence | FL162Q01HA–FL162Q06HA | Confidence in bank-related tasks | Ordinal |
| Digital confidence | FL163Q01HA–FL163Q05HA | Confidence in digital financial tasks | Ordinal |
| Financial behaviour | FL168Q01HA–FL168Q08HA | Observed financial practices and monitoring | Binary |
| Financial attitude | FL169Q01HA–FL169Q04HA | Perceived relevance and value of money matters | Ordinal |
2.3.Coding & Measurement Model
Several items were reverse-coded so that higher values reflected a theoretically consistent direction. FL159Q02HA and FL159Q03HA were reversed because needing permission for spending reflects lower autonomy. FL160Q03HA was reversed when it was used as part of careful price behaviour because buying without comparing prices reflects less careful behaviour. FL169Q03HA was reversed because the statement that money matters are not relevant now reflects a lower financial attitude orientation. The FL168 yes-or-no items were recoded as binary variables, where one represented yes and zero represented no. This coding step was necessary because the PISA questionnaire includes mixed response formats, and the direction of the indicators must be clear before measurement modelling.
Composite mean scores were computed only for preliminary descriptive analysis. The main analysis used latent factor scores estimated from an ordinal CFA model. This distinction is important because the selected PISA questionnaire items represent non-cognitive latent constructs, not directly observed continuous variables. The ordinal CFA model used WLSMV (Weighted Least Squares Mean and Variance Adjusted) estimation, ordered categorical indicators, theta parameterisation, and standardised latent variances. The six latent constructs were financial autonomy, careful price behaviour, bank confidence, digital confidence, financial behaviour, and financial attitude. The use of WLSMV was chosen because it is appropriate for ordered categorical indicators and has been recommended in applied factor analysis when Likert-type and binary indicators are analysed as manifestations of latent variables [34][35].
The descriptive table (Table 2) is therefore useful as an entry point, but it is insufficient as the basis for the main conclusion. If the analysis stopped at mean scores, the article might conclude that male students were more confident and more impulsive while female students were more careful and slightly more attitude-oriented. Such a conclusion would be incomplete because it would ignore the latent nature of the constructs and the mixed response formats of the indicators. The more appropriate question is whether these dimensions combine into broader financial behaviour profiles and whether gender is meaningfully associated with those profiles after measurement issues have been addressed.
| Gender | n | Autonomy | Careful price | Impulsive spending | Bank confidence | Digital confidence | Financial behaviour | Financial attitude |
|---|---|---|---|---|---|---|---|---|
| Female | 3,032 | 2.517 | 2.764 | 1.496 | 2.343 | 2.339 | 0.738 | 2.854 |
| Male | 2,801 | 2.559 | 2.712 | 1.577 | 2.467 | 2.447 | 0.760 | 2.826 |
2.4.Machine Learning Profiling & Gender Analysis
After the ordinal CFA model was estimated, latent factor scores were extracted using the CFA model and used as the input for machine learning profiling. The six latent score variables were standardised before clustering. The number of clusters was examined by comparing alternative solutions rather than being determined solely by theoretical expectations. Candidate solutions (k = 2, 3, and 4) were evaluated using cluster separation and interpretability criteria, including silhouette-based evaluation and substantive examination of cluster patterns. The two-cluster solution was retained because additional clusters did not produce sufficiently distinct behavioural configurations and mainly separated students along the same general financial engagement continuum. Therefore, the identified profiles are interpreted as levels of overall financial engagement rather than completely different behavioural types. This interpretation is important because all six latent dimensions showed a consistent direction, indicating that the clustering primarily captured differences in intensity across financial behaviour dimensions. The final labels were assigned after examining cluster characteristics rather than before the clustering process.
Gender analysis was conducted in three steps. First, the proportion of female and male students was calculated within each profile. Second, a chi-square test and Cramer's V were used to examine whether gender was associated with profile membership. Third, multinomial logistic regression was used to estimate profile membership from gender and grade level. Because PISA data are collected through a complex sampling design involving students nested within schools, regression estimates were interpreted cautiously. The available analytical output used conventional standard errors; therefore, the reported p-values may underestimate uncertainty if school-level clustering is considered. The adjusted gender effect is consequently treated as a robustness indicator rather than definitive evidence of a population-level association.
3.Results and Discussion
3.1.Descriptive Statistics
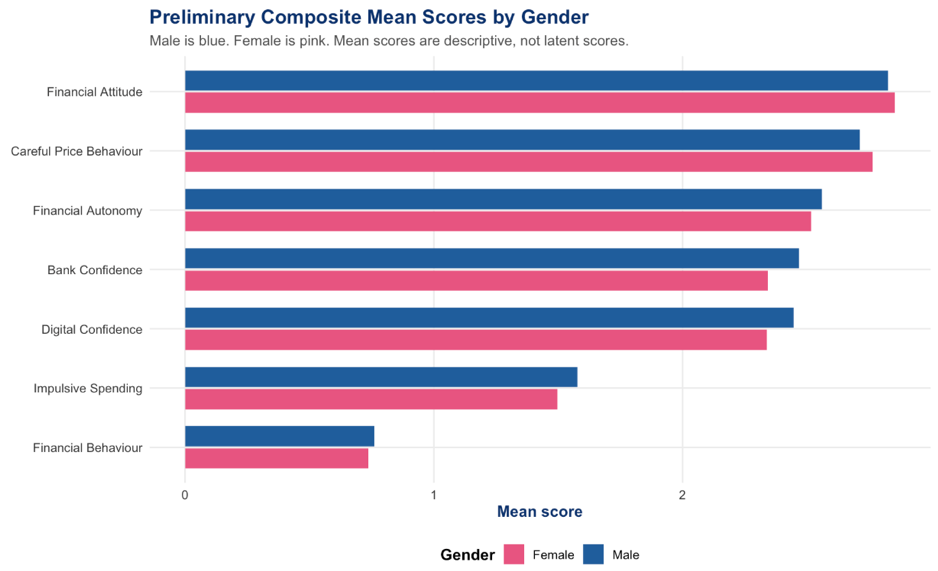
The complete-case sample contained 5,833 students, consisting of 3,032 female students and 2,801 male students. Female students represented 52.0 percent of the analytic sample, while male students represented 48.0 percent. This composition indicates that the sample was relatively balanced by gender, which allows an initial descriptive comparison between female and male students. Before conducting the main measurement analysis, this study first examined preliminary composite mean scores across seven financial dimensions. The results are shown in Fig. 1. The scores represent raw composite means, not latent scores. Complete-case filtering retained 5,833 of 7,133 students (81.8%) and excluded 1,300 (18.2%). The supplied output did not report gender- or grade-specific retention tests; therefore, differential retention by gender and grade could not be evaluated.
Fig. 1 shows that gender differences in the preliminary financial measures were generally small and varied across constructs. Male students recorded slightly higher mean scores for financial autonomy with 2.559 compared with 2.517 among female students. Male students also showed higher scores in the descriptive single-item impulsive-spending indicator with 1.577 compared with 1.496, bank confidence with 2.467 compared with 2.343, digital confidence with 2.447 compared with 2.339, and financial behaviour with 0.760 compared with 0.738. In contrast, female students recorded slightly higher mean scores for careful price behaviour with 2.764 compared with 2.712 among male students. Female students also showed a slightly higher score in financial attitude with 2.854 compared with 2.826. The impulsive-spending value should not be interpreted as a separate latent dimension because it is the unreversed descriptive form of FL160Q03HA, which contributes in reverse direction to the careful price behaviour construct. All differences remain descriptive and should not be interpreted as evidence of statistical or causal differences.
3.2.Reliability, Factorability, & Ordinal CFA
The preliminary reliability results showed that bank confidence and digital confidence had very high internal consistency (see Table 3), with Cronbach's alpha values of 0.922 and 0.918, respectively. Other preliminary scales showed substantially weaker alpha values. Careful price behaviour had an alpha of 0.363, financial behaviour had an alpha of 0.549, and financial attitude had an alpha of 0.337. Most importantly, financial autonomy produced a negative alpha of -1.361. A negative alpha indicates negative average inter-item covariance and is a serious warning about coding direction, content coherence, or the suitability of a single-factor representation. Although alpha is not sufficient as a stand-alone indicator of scale quality, this extreme result cannot be dismissed merely because the indicators are ordinal or heterogeneous. The autonomy factor score should be interpreted only if the standardised loadings are directionally coherent and sufficiently strong and if a model-based reliability coefficient, such as McDonald's omega, is acceptable. The same requirement applies, though less severely, to careful price behaviour and financial attitude. These findings are consistent with the broader psychometric argument that alpha is not a sufficient indicator of scale quality, especially when constructs are short, multidimensional, or composed of behaviourally diverse indicators [38][39][53][54].
| Scale | Items | Raw alpha | Standardized alpha |
|---|---|---|---|
| Financial autonomy | 4 | -1.361 | -1.375 |
| Careful price behaviour | 4 | 0.363 | 0.359 |
| Bank confidence | 6 | 0.922 | 0.922 |
| Digital confidence | 5 | 0.918 | 0.918 |
| Financial behaviour | 4 | 0.549 | 0.559 |
| Financial attitude | 4 | 0.337 | 0.347 |
The factorability diagnostics supported further latent modelling. The Kaiser-Meyer-Olkin value was 0.91, which indicates that the selected items were suitable for factor analysis. Bartlett's test of sphericity was significant, 𝜒2= 78,410.36, p < 0.001, indicating that the correlation matrix was not an identity matrix. Parallel analysis suggested up to eight factors. However, the final CFA model used six theoretically interpretable dimensions because the research objective was not to maximise the number of extracted factors, but to model meaningful financial behaviour constructs that could be used for profiling. This decision reflects a balance between empirical dimensionality and construct interpretability.
Based on Table 4, the six-factor ordinal CFA demonstrated acceptable overall model fit, with CFI = 0.992, TLI = 0.991, RMSEA = 0.063, and SRMR = 0.059. Although the CFI and TLI indicated strong incremental fit, these indices should not be interpreted independently of the absolute fit indices or item-level measurement evidence, particularly under WLSMV estimation with theta parameterisation. The RMSEA and SRMR indicated adequate rather than exceptional fit. Consequently, the standardised loadings, category thresholds, construct reliability, and latent-factor correlations were examined to determine whether the six constructs provided sufficiently coherent measurement scores for the subsequent clustering analysis.
| Fit index | Value |
|---|---|
| CFI | 0.992 |
| TLI | 0.991 |
| RMSEA | 0.063 |
| SRMR | 0.059 |
Table 5 presents the standardised ordinal-CFA loadings and estimated category thresholds. The results showed consistently strong and positive loadings for Bank Confidence, Digital Confidence, and Financial Behaviour. However, several reverse-coded items produced negative loadings. Specifically, FL160Q03HA_R loaded negatively on Careful Price Behaviour at −0.436, FL169Q03HA_R loaded negatively on Financial Attitude at −0.298, and FL159Q02HA_R and FL159Q03HA_R loaded negatively on Financial Autonomy at −0.821 and −0.609, respectively. These negative coefficients suggest that the coding direction, item wording, or factor specification of the affected items may not be aligned with the intended construct orientation.
| Construct | Item | Standardised loading | SE | p | Number of thresholds | Minimum threshold | Maximum threshold | Estimated thresholds |
|---|---|---|---|---|---|---|---|---|
| Bank Confidence | FL162Q01HA | 0,58680556 | 0.004 | <0.001 | 3 | −1.881 | 2.790 | τ1 = −1.881; τ2 = 0.208; τ3 = 2.790 |
| Bank Confidence | FL162Q02HA | 0,62083333 | 0.003 | <0.001 | 3 | −2.496 | 3.319 | τ1 = −2.496; τ2 = −0.169; τ3 = 3.319 |
| Bank Confidence | FL162Q03HA | 0,63541667 | 0.002 | <0.001 | 3 | −2.694 | 3.910 | τ1 = −2.694; τ2 = 0.142; τ3 = 3.910 |
| Bank Confidence | FL162Q04HA | 0,59444444 | 0.004 | <0.001 | 3 | −1.858 | 3.183 | τ1 = −1.858; τ2 = 0.535; τ3 = 3.183 |
| Bank Confidence | FL162Q05HA | 0,62361111 | 0.003 | <0.001 | 3 | −2.311 | 3.631 | τ1 = −2.311; τ2 = 0.385; τ3 = 3.631 |
| Bank Confidence | FL162Q06HA | 0,54513889 | 0.005 | <0.001 | 3 | −1.919 | 1.978 | τ1 = −1.919; τ2 = −0.354; τ3 = 1.978 |
| Careful Price Behaviour | FL160Q01HA | 0,59652778 | 0.007 | <0.001 | 3 | −2.959 | 1.045 | τ1 = −2.959; τ2 = −1.046; τ3 = 1.045 |
| Careful Price Behaviour | FL160Q02HA | 0,63402778 | 0.007 | <0.001 | 3 | −3.433 | 1.366 | τ1 = −3.433; τ2 = −1.311; τ3 = 1.366 |
| Careful Price Behaviour | FL160Q03HA_R | −0.436 | 0.013 | <0.001 | 3 | −1.301 | 1.153 | τ1 = −1.301; τ2 = 0.004; τ3 = 1.153 |
| Careful Price Behaviour | FL160Q04HA | 0,45069444 | 0.010 | <0.001 | 3 | −1.397 | 1.328 | τ1 = −1.397; τ2 = −0.232; τ3 = 1.328 |
| Digital Confidence | FL163Q01HA | 0,60416667 | 0.003 | <0.001 | 3 | −2.170 | 2.805 | τ1 = −2.170; τ2 = −0.070; τ3 = 2.805 |
| Digital Confidence | FL163Q02HA | 0,63125 | 0.003 | <0.001 | 3 | −2.493 | 3.816 | τ1 = −2.493; τ2 = 0.451; τ3 = 3.816 |
| Digital Confidence | FL163Q03HA | 0,61527778 | 0.003 | <0.001 | 3 | −2.173 | 3.263 | τ1 = −2.173; τ2 = 0.247; τ3 = 3.263 |
| Digital Confidence | FL163Q04HA | 0,59791667 | 0.004 | <0.001 | 3 | −1.928 | 2.958 | τ1 = −1.928; τ2 = 0.337; τ3 = 2.958 |
| Digital Confidence | FL163Q05HA | 0,58958333 | 0.004 | <0.001 | 3 | −2.058 | 2.497 | τ1 = −2.058; τ2 = −0.061; τ3 = 2.497 |
| Financial Attitude | FL169Q01HA | 0,49236111 | 0.011 | <0.001 | 3 | −2.442 | 1.751 | τ1 = −2.442; τ2 = −0.852; τ3 = 1.751 |
| Financial Attitude | FL169Q02HA | 0,55763889 | 0.010 | <0.001 | 3 | −3.179 | 1.591 | τ1 = −3.179; τ2 = −1.627; τ3 = 1.591 |
| Financial Attitude | FL169Q03HA_R | −0.298 | 0.015 | <0.001 | 3 | −1.611 | 1.722 | τ1 = −1.611; τ2 = 0.183; τ3 = 1.722 |
| Financial Attitude | FL169Q04HA | 0,46875 | 0.011 | <0.001 | 3 | −2.706 | 0,48194444 | τ1 = −2.706; τ2 = −1.693; τ3 = 0.694 |
| Financial Autonomy | FL159Q01HA | 0,55555556 | 0.007 | <0.001 | 3 | −2.683 | 1.396 | τ1 = −2.683; τ2 = −1.825; τ3 = 1.396 |
| Financial Autonomy | FL159Q02HA_R | −0.821 | 0.006 | <0.001 | 3 | −1.242 | 3.210 | τ1 = −1.242; τ2 = 1.924; τ3 = 3.210 |
| Financial Autonomy | FL159Q03HA_R | −0.609 | 0.009 | <0.001 | 3 | −1.175 | 2.215 | τ1 = −1.175; τ2 = 1.069; τ3 = 2.215 |
| Financial Autonomy | FL159Q04HA | 0,56875 | 0.007 | <0.001 | 3 | −3.199 | 1.042 | τ1 = −3.199; τ2 = −2.285; τ3 = 1.042 |
| Financial Behaviour | FL168Q01HA_bin | 0,44166667 | 0.034 | <0.001 | 1 | −1.836 | −1.836 | τ1 = −1.836 |
| Financial Behaviour | FL168Q04HA_bin | 0,575 | 0.021 | <0.001 | 1 | −0.838 | −0.838 | τ1 = −0.838 |
| Financial Behaviour | FL168Q06HA_bin | 0,43611111 | 0.021 | <0.001 | 1 | −0.027 | −0.027 | τ1 = −0.027 |
| Financial Behaviour | FL168Q08HA_bin | 0,48263889 | 0.026 | <0.001 | 1 | −1.662 | −1.662 | τ1 = −1.662 |
Note. _R identifies items intended to be reverse-coded, whereas _bin identifies binary-coded items. The symbol τ represents an estimated ordinal-category threshold. Negative loadings among reverse-coded items indicate that item coding, factor orientation, or construct specification should be re-examined.
The construct-level measurement results are summarised in Table 6. Bank Confidence demonstrated strong loadings ranging from 0.785 to 0.915 and excellent model-based reliability, with McDonald's ω = 0.947. Digital Confidence similarly showed consistently strong loadings ranging from 0.849 to 0.909 and an omega coefficient of 0.942. Financial Behaviour also demonstrated acceptable measurement quality, with loadings ranging from 0.628 to 0.828 and ω = 0.792.
In contrast, Careful Price Behaviour showed a loading range from −0.436 to 0.913 and a marginal omega coefficient of 0.684. Financial Attitude showed a loading range from −0.298 to 0.803 and relatively low reliability, with ω = 0.608. The most serious measurement weakness was observed for Financial Autonomy. Its loadings ranged from −0.821 to 0.819, while its omega coefficient was only 0.021. This near-zero reliability estimate indicates that the four items did not form a coherent unidimensional score under the current coding and factor specification.
| Construct | Number of items | Minimum loading | Maximum loading | Minimum threshold | Maximum threshold | McDonald's ω | Measurement assessment |
|---|---|---|---|---|---|---|---|
| Bank Confidence | 6 | 0,54513889 | 0,63541667 | −2.694 | 3.910 | 0,65763889 | All loadings were positive, and model-based reliability was satisfactory. |
| Careful Price Behaviour | 4 | −0.436 | 0,63402778 | −3.433 | 1.366 | 0,475 | One item loaded negatively, and reliability was marginal. Item direction or factor specification should be rechecked. |
| Digital Confidence | 5 | 0,58958333 | 0,63125 | −2.493 | 3.816 | 0,65416667 | All loadings were positive, and model-based reliability was satisfactory. |
| Financial Attitude | 4 | −0.298 | 0,55763889 | −3.179 | 1.751 | 0,42222222 | One item loaded negatively, and reliability was below the conventional 0.70 criterion. |
| Financial Autonomy | 4 | −0.821 | 0,56875 | −3.199 | 3.210 | 0.021 | Two reverse-coded items loaded negatively, and model-based reliability was unacceptable. |
| Financial Behaviour | 4 | 0,43611111 | 0,575 | −1.836 | −0.027 | 0,55 | All loadings were positive, and model-based reliability was satisfactory. |
Note. McDonald's omega values of approximately 0.70 or higher are commonly regarded as acceptable for research purposes. However, reliability should also be evaluated alongside the number of items, loading pattern, construct breadth, and intended use of the resulting scores.
Table 7 presents the standardised correlations among the six latent factors. Most correlations were positive and low to moderate, ranging from 0.172 to 0.528. Financial Autonomy was most strongly associated with Financial Attitude, with a correlation of 0.528, while its weakest association was with Financial Behaviour, with a correlation of 0.172. Careful Price Behaviour showed moderate correlations with Financial Attitude, Financial Behaviour, Bank Confidence, and Digital Confidence.
The largest latent-factor correlation was observed between Bank Confidence and Digital Confidence, with r = 0.817. This result indicates substantial shared variance between the two constructs and may suggest limited discriminant validity. Although the correlation remained below unity, its magnitude indicates that confidence in conventional banking activities and confidence in digital financial activities may represent closely related dimensions in this sample.
Taken together, the findings indicate that acceptable global CFA fit did not correspond to uniformly adequate construct-level measurement. Bank Confidence, Digital Confidence, and Financial Behaviour produced coherent loading patterns and satisfactory reliability. By contrast, Careful Price Behaviour and Financial Attitude contained negatively loading reverse-coded items and produced marginal or weak reliability estimates. Financial Autonomy demonstrated particularly poor internal coherence and should not be interpreted as a reliable latent score under the current specification.
| Factor 1 | Factor 2 | Correlation | SE | p |
|---|---|---|---|---|
| Financial Autonomy | Careful Price Behaviour | 0,27708333 | 0.014 | <0.001 |
| Bank Confidence | 0,19027778 | 0.014 | <0.001 | |
| Digital Confidence | 0,15208333 | 0.014 | <0.001 | |
| Financial Behaviour | 0,11944444 | 0.020 | <0.001 | |
| Financial Attitude | 0,36666667 | 0.014 | <0.001 | |
| Careful Price Behaviour | Bank Confidence | 0,21180556 | 0.013 | <0.001 |
| Digital Confidence | 0,21666667 | 0.013 | <0.001 | |
| Financial Behaviour | 0,24652778 | 0.018 | <0.001 | |
| Financial Attitude | 0,28263889 | 0.015 | <0.001 | |
| Bank Confidence | Digital Confidence | 0,56736111 | 0.005 | <0.001 |
| Financial Behaviour | 0,20416667 | 0.018 | <0.001 | |
| Financial Attitude | 0,22708333 | 0.015 | <0.001 | |
| Digital Confidence | Financial Behaviour | 0,24027778 | 0.018 | <0.001 |
| Financial Attitude | 0,22361111 | 0.014 | <0.001 | |
| Financial Behaviour | Financial Attitude | 0,18680556 | 0.021 | <0.001 |
Note. All reported correlations were statistically significant at p < 0.001. The comparatively high correlation between Bank Confidence and Digital Confidence suggests substantial conceptual overlap and should be considered when evaluating discriminant validity.
Accordingly, the reverse coding of FL160Q03HA_R, FL169Q03HA_R, FL159Q02HA_R, and FL159Q03HA_R should be verified against the original PISA response categories and questionnaire wording. If the negative loadings remain after coding verification, the affected constructs should be respecified by correcting their factor orientation, removing incompatible items, or excluding the construct when adequate model-based reliability cannot be established. The factor scores and clustering results should therefore be regarded as provisional until the affected measurement models have been re-estimated and the clustering analysis has been recomputed using verified construct scores.
3.3.Measurement Invariance by Gender
Measurement invariance testing was conducted to examine whether the latent financial behaviour constructs could be compared across female and male students. Table 8 describes the configural, metric, scalar or threshold, and strict models all showed stable fit indices. The changes in CFI were 0.000 across the successive models, and the changes in RMSEA were very small. This result supports the interpretation that the measurement structure was broadly comparable across gender groups. In other words, gender comparisons and gender-profile analyses are less likely to be confounded by major differences in the way the latent constructs functioned across female and male students.
| Model | CFI | TLI | RMSEA | SRMR | Delta CFI | Delta RMSEA |
|---|---|---|---|---|---|---|
| Configural | 0.992 | 0.991 | 0.062 | 0.059 | - | - |
| Metric | 0.992 | 0.991 | 0.063 | 0.060 | 0.000 | 0.001 |
| Scalar/Threshold | 0.992 | 0.991 | 0.061 | 0.060 | 0.000 | -0.002 |
| Strict | 0.991 | 0.991 | 0.061 | 0.060 | 0.000 | 0.000 |
This finding is important for the conceptual aim of the article. If the measures were not comparable across gender, then any discussion of gendered profiles would be questionable. The invariance evidence does not mean that female and male students have identical financial behaviour. It means that the measurement model provides a reasonably stable basis for comparing latent scores and examining profile membership. This strengthens the argument that the study can discuss gender representation in profiles without treating gender as the construct itself.
3.4.Two Financial Behaviour Profiles
K-means clustering of latent factor scores produced two financial behaviour profiles. From Table 9 and Fig. 2, profile 1 contained 2,821 students, or 48.36 percent of the complete-case sample. Profile 2 contained 3,012 students, or 51.64 percent. The two clusters were not labelled by gender. They were labelled by their latent financial behaviour characteristics. Profile 1 showed higher mean latent factor scores across all six dimensions: financial autonomy, careful price behaviour, bank confidence, digital confidence, financial behaviour, and financial attitude. Profile 2 showed lower mean latent factor scores across the same dimensions. Therefore, Profile 1 was labelled the Higher Financial Engagement Profile and Profile 2 was labelled the Lower Financial Engagement Profile.
| Profile | n | Autonomy | Careful price | Bank confidence | Digital confidence | Financial behaviour | Financial attitude | Suggested name |
|---|---|---|---|---|---|---|---|---|
| 1 | 2,821 | 0.431 | 0.485 | 0.584 | 0.596 | 0.347 | 0.477 | Higher Financial Engagement Profile |
| 2 | 3,012 | -0.414 | -0.487 | -0.561 | -0.573 | -0.433 | -0.468 | Lower Financial Engagement Profile |
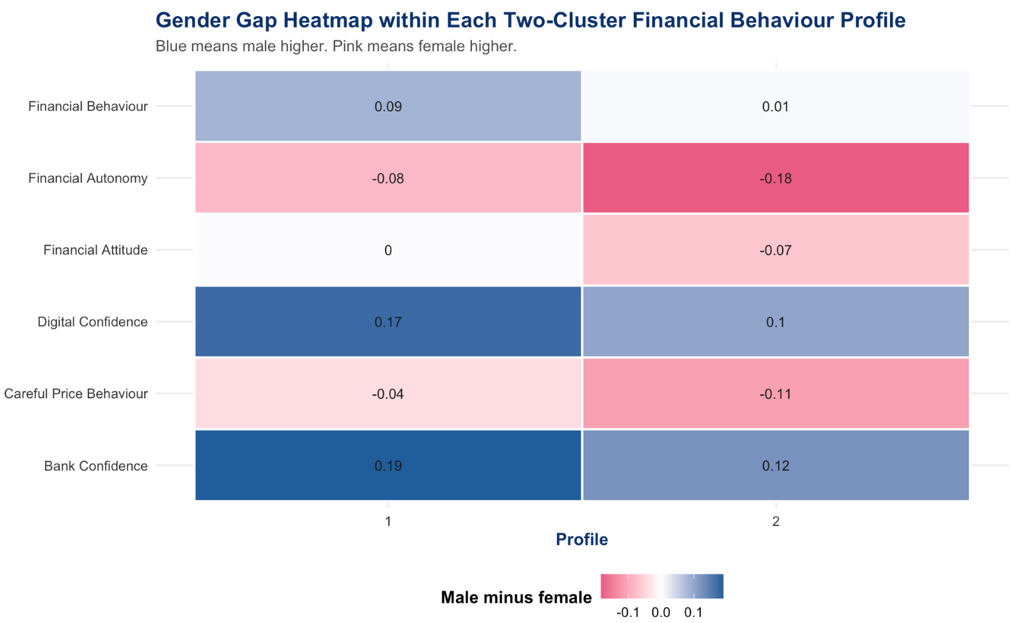
Table 6 shows that the largest between-group differences occurred in digital confidence and bank confidence, followed by careful price behaviour and financial attitude. However, the common direction of all six centroids is more important than their rank order: the solution does not identify a high-confidence/low-care configuration or another clearly differentiated behavioural pattern. It separates students who are generally higher across the measured dimensions from those who are generally lower. Fig. 2, which displays male-minus-female differences within each engagement group, likewise shows relatively modest within-profile gender gaps. Male students were somewhat higher in bank and digital confidence, while female students were somewhat higher in autonomy or careful price behaviour in parts of the solution. These small within-profile contrasts do not create distinct male and female reasoning types.
3.5.Gender Distribution Across Profiles
Gender was examined after clustering. The distribution of gender across the two profiles was relatively balanced (see Fig. 3). From Table 10, female students in profile 1 represented 50.97 percent and male students in profile 1 represented 49.03 percent. In Profile 2, female students represented 52.92 percent and male students represented 47.08 percent. This pattern indicates that both profiles contained substantial numbers of female and male students. Although female students were slightly more represented in both profiles, the differences were small. The chi-square test confirmed that gender and profile membership were not meaningfully associated, 𝜒2(1) = 2.1346, p = 0.144, Cramer's V = 0.0191 (see Table 11).
| Profile | Gender | n | Percent within profile |
|---|---|---|---|
| 1 | Female | 1,438 | 50.97 |
| Male | 1,383 | 49.03 | |
| 2 | Female | 1,594 | 52.92 |
| Male | 1,418 | 47.08 |
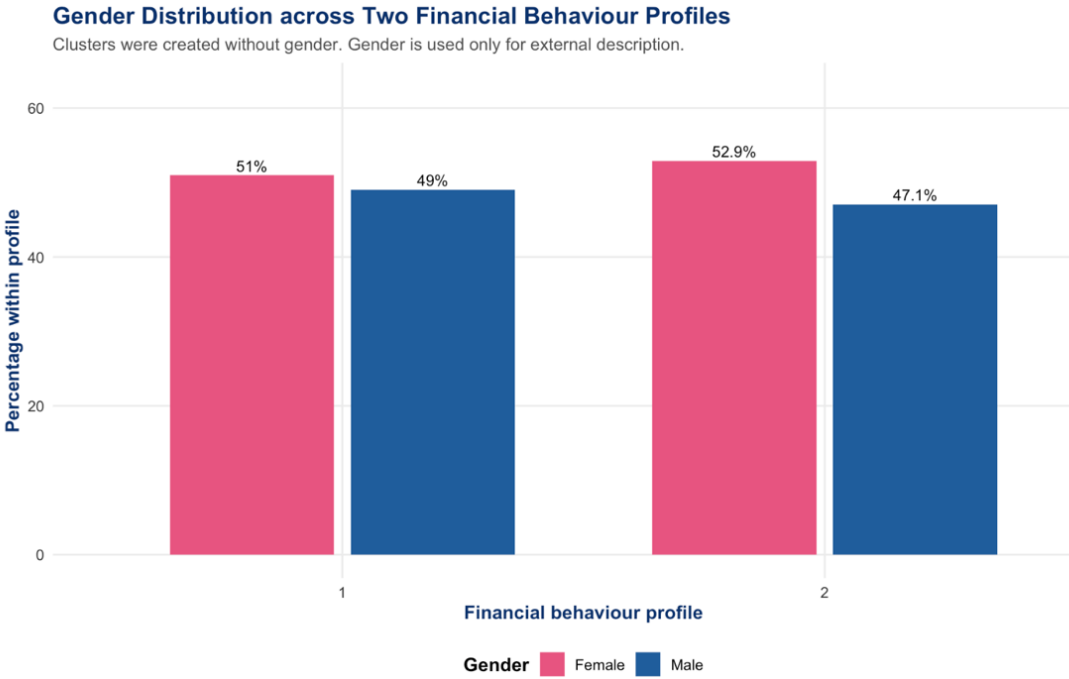
This result is central to the interpretation of "Boy Math" and "Girl Math". If those terms represented strong empirical gender categories, one would expect a clear gender concentration in one profile or the other. That did not occur. The two profiles were primarily distinguished by latent financial behaviour dimensions rather than by gender composition. The finding does not deny that gender may shape financial socialisation, confidence, or opportunity. Instead, it shows that in this sample, the measured profiles were not reducible to female and male categories. Therefore, the safer interpretation is that gendered cultural narratives may point toward real questions about confidence, behaviour, and attitude, but they should not be treated as evidence that boys and girls have fixed financial reasoning styles.
| Statistic | df | p value | Cramer's V |
|---|---|---|---|
| 2.1346 | 1 | 0.1440 | 0.0191 |
The regression result added a more nuanced finding. Male students had lower odds of belonging to Profile 1 than female students after grade level was controlled, OR = 0.864, p = 0.006. Grade level also predicted profile membership, OR = 0.667, p < 0.001. This adjusted result is not logically inconsistent with the non-significant chi-square test because the two analyses address different estimands: the chi-square test assesses the unadjusted marginal association, whereas the regression estimates the gender association conditional on grade. Adjustment can reveal a small conditional relationship that is not apparent in the unadjusted cross-tabulation. Nevertheless, the odds ratio is close to one, Cramer's V is negligible, both profiles remain gender-balanced, and the reported regression used conventional rather than school-clustered standard errors. The adjusted gender coefficient is therefore statistically detectable but substantively small and inferentially provisional; it does not justify describing either engagement level as a female or male profile.
3.6.Internal Reclassification Diagnostic
Random Forest was applied to evaluate how well the six latent dimensions reproduced the two-profile solution. The model produced an out-of-bag error rate of 2.73 percent, corresponding to an out-of-bag accuracy of 97.27 percent. This high accuracy means that the two clusters were highly separable by the latent financial behaviour dimensions. The result should be interpreted as profile classification fidelity, not as external predictive validity. The same latent variables that generated the clusters were also used to classify the clusters. Therefore, the Random Forest model confirms that the cluster solution is internally coherent and interpretable, but it does not prove that the same model would predict independent real-world financial outcomes with equal accuracy.
The Random Forest variable-importance results are presented in Table 12. Financial Attitude showed the highest overall importance, with a Mean Decrease Accuracy of 102.283 and a Mean Decrease Gini of 710.175. Careful Price Behaviour ranked second according to Mean Decrease Accuracy at 97.369, whereas Digital Confidence ranked second according to Mean Decrease Gini at 591.620. These differences indicate that the relative ranking of the dimensions depended on the importance metric used.
The profile-specific importance values also showed different patterns across the two clusters. For Profile 1, Financial Attitude produced the highest importance value at 88.458, followed by Financial Behaviour at 84.462 and Financial Autonomy at 75.888. For Profile 2, Careful Price Behaviour ranked highest at 72.618, followed by Financial Attitude at 70.554 and Digital Confidence at 55.952. Bank Confidence had the lowest profile-specific importance value for Profile 2 and the lowest overall Mean Decrease Accuracy.
| Variable | Profile 1 importance | Profile 2 importance | Mean Decrease Accuracy | Mean Decrease Gini |
|---|---|---|---|---|
| Financial Attitude | 88.458 | 70.554 | 102.283 | 710.175 |
| Digital Confidence | 56.817 | 55.952 | 75.228 | 591.620 |
| Careful Price Behaviour | 72.628 | 72.618 | 97.369 | 525.397 |
| Financial Behaviour | 84.462 | 52.700 | 75.302 | 419.385 |
| Bank Confidence | 58.267 | 48.503 | 69.652 | 413.473 |
| Financial Autonomy | 75.888 | 55.134 | 85.359 | 252.759 |
Note. Profile 1 and Profile 2 importance values represent class-specific contributions to the correct classification of each profile. Mean Decrease Accuracy indicates the reduction in classification accuracy after the values of a variable are permuted. Mean Decrease Gini indicates the accumulated reduction in node impurity attributable to a variable across the decision trees. Higher values indicate a stronger contribution to internal profile classification.
Financial Attitude made the strongest overall contribution to reconstructing the profile labels. However, the class-specific results showed that the dimensions did not contribute equally to both profiles. Financial Attitude and Financial Behaviour were especially influential in reconstructing Profile 1, whereas Careful Price Behaviour and Financial Attitude were the most influential dimensions for Profile 2. Digital Confidence had a comparatively high Mean Decrease Gini despite its lower class-specific and Mean Decrease Accuracy values, suggesting that it frequently contributed to impurity reduction across the trees without producing the same degree of deterioration in predictive accuracy when permuted.
Financial Autonomy produced a relatively high Mean Decrease Accuracy of 85.359 but the lowest Mean Decrease Gini of 252.759. This divergence indicates that the variable affected classification accuracy when disrupted but was used less extensively or produced smaller impurity reductions across the tree-building process. Nevertheless, its importance should be interpreted with particular caution because the ordinal CFA results indicated severe measurement problems for the Financial Autonomy construct.
These importance values should not be interpreted as evidence that the dimensions independently predict real-world financial outcomes. The same six latent dimensions were used both to create the cluster labels and to reconstruct them. Consequently, the results primarily describe how the variables contributed to the internal geometric separation generated by the clustering procedure. The Random Forest analysis is therefore retained only as an internal reclassification and reproducibility diagnostic, while the cluster centroids provide the more direct description of the differences between the two profiles.
3.7.Discussion
The findings support a cautious reinterpretation of "Boy Math" and "Girl Math". These terms may attract public attention, but they have limited scientific value when treated as fixed gender categories. The empirical results did not reveal distinctly male or female financial types. Instead, the analysis identified differences in levels of financial engagement. One profile showed stronger digital confidence, bank confidence, careful price behaviour, financial attitude, financial autonomy, and financial behaviour. The other profile showed weaker performance across these dimensions. Since both profiles included substantial numbers of female and male students, the results challenge gender-essentialist interpretations and support a needs-based approach to financial education. This interpretation aligns with prior studies showing that financial literacy gaps should not be reduced to simple gender stereotypes, because confidence, response patterns, and socialisation can shape observed differences [14][15][16][21].
The results also reinforce a broader point in financial literacy research. Financial literacy is not only a matter of knowledge. It also involves attitudes, confidence, decision-making, and behaviour [4][7][8]. This explains why a single gender label cannot capture students' financial learning needs. The observed profiles are more useful because they identify combinations of strengths and weaknesses across several financial dimensions. This is consistent with OECD's view that financial literacy should support informed decisions, responsible behaviour, and participation in increasingly digital financial environments [2][3][5].
Methodologically, this study shows the importance of placing measurement analysis before machine learning classification. Random Forest can classify students with high accuracy, but accuracy alone cannot establish construct validity [25][30][55]. For this reason, the study first used ordinal CFA and measurement invariance testing to strengthen the interpretation of the latent scores. This step matters because questionnaire items are ordinal and may not contribute equally to each construct [40][34][41]. Measurement invariance testing also helped assess whether constructs had comparable meaning across groups before the profiles were interpreted [31][32][46]. After this stage, clustering and Random Forest analysis served as tools for pattern detection and interpretation, not as substitutes for measurement validity.
The Indonesian PISA context gives these findings practical relevance. Access to financial products and digital services does not automatically produce confidence, careful behaviour, or sound financial attitudes. Students may use digital tools without fully understanding how to compare prices, monitor spending, interpret bank information, or evaluate financial risks. Prior research also shows that financial education can improve financial knowledge and downstream behaviour, especially when learning is structured, relevant, and connected to real decisions [10][11][12][13]. Therefore, students in the lower engagement profile may need practical learning activities on price comparison, budgeting, digital transaction safety, bank statement reading, and reflective money attitudes. Students in the higher engagement profile may need more advanced tasks on financial risk, entrepreneurship, saving strategies, and responsible digital finance.
The findings suggest that gender-sensitive financial education should not rely on gender-segregated assumptions. A gender-sensitive approach should recognise that students may face different expectations, opportunities, confidence levels, and financial socialisation. However, it should not assume that female students naturally think in one financial style and male students in another. The weak association between gender and profile membership supports interventions based on measured needs rather than stereotypes. In practice, teachers and policymakers should focus on confidence-building, behavioural monitoring, and digital financial literacy for all students, while still checking whether specific groups face barriers in access, encouragement, or self-efficacy.
This study has several limitations. First, the analysis used complete cases and did not apply official PISA sampling weights or replicate weights. Future research should use the full PISA complex survey design to produce population-level estimates. Second, the study relied on secondary questionnaire data, so it could not include variables such as social media exposure, parental allowance, school financial education content, or actual digital payment use. Third, the profiles came from cross-sectional data, so they should not be interpreted as developmental pathways. Fourth, Random Forest accuracy should be read as cluster classification fidelity, because the model predicted labels created from the same latent dimensions. Future studies should test whether these profiles predict external outcomes, such as cognitive financial literacy performance, saving behaviour, digital payment practices, or financial well-being.
4.Conclusion
This study examined whether the popular discourse of "Boy Math" and "Girl Math" could be reframed through measurable financial behaviour patterns among Indonesian students. Using PISA 2018 Financial Literacy Questionnaire data, the study estimated latent financial behaviour dimensions through ordinal CFA, tested measurement invariance by gender, clustered students using latent factor scores, examined gender after clustering, and used Random Forest as a secondary internal reclassification diagnostic. The final two-group solution identified a Higher Financial Engagement Profile and a Lower Financial Engagement Profile. Because all six centroids differed in the same direction, these groups are better understood as engagement levels rather than distinct financial reasoning styles. Their interpretation also remains conditional on fuller reporting of item loadings, thresholds, factor correlations, and model-based reliability, especially for the financial autonomy construct.
The results show that gender should not be used to define the engagement groups. Female and male students were distributed relatively evenly across both groups, and the unadjusted gender-profile association was weak and non-significant. The adjusted regression indicated a statistically significant but small gender coefficient after grade was controlled. These findings are not contradictory: the chi-square test estimates the marginal association, whereas the regression estimates the association conditional on grade. Given the odds ratio close to one, negligible Cramer's V, balanced group composition, and the absence of school-clustered standard errors, the adjusted result should be treated as substantively minor and provisional. The main conclusion is therefore that "Boy Math" and "Girl Math" are cultural labels that can motivate research questions, not empirical categories of financial reasoning. Financial literacy interventions should be designed around measured needs and engagement levels rather than gender stereotypes. Future studies should strengthen measurement reporting, apply survey-design corrections, evaluate alternative cluster solutions, and test the groups against independent financial literacy or socioeconomic outcomes.
Author Contribution: All authors contributed equally to the main contributor to this paper. All authors read and approved the final paper.
Funding: This research received no external funding.
Conflicts of Interest: The authors declare no conflict of interest.