
Vol. 3, No. 1, 2025, pp. 31-39
ISSN 3030-9174
https://e-journal.ptti.info/index.php/ijase
Product Defect Analysis in Almond Cookies using Statistical Quality Control
b Food Technology Department, Universiti Sultan Zainal Abidin, 22200, Malaysia
c Department of Food Science and Technology, Rufus Giwa Polytechnic, 341104, Nigeria
1 destia2111033032@webmail.uad.ac.id; 2 safinta.rahmadhia@tp.uad.ac.id
* Corresponding Author
Article history Received June 20, 2026
Revised July 18, 2026
Accepted September 01, 2026
Defect Analysis;
Pareto Diagram;
Quality Control;
Statistical Process Control

Quality control is an essential aspect of food production because product defects can reduce consumer acceptance, production efficiency, and economic value. Small-scale food industries often face challenges in maintaining product consistency due to limited quality control systems and resources. Therefore, this study aimed to characterize product defects and provide an initial evaluation of production-process variability in almond cookies produced by a small-scale food industry in Yogyakarta using a Statistical Quality Control (SQC) approach. A descriptive observational study was conducted on four production batches comprising 2,125 almond cookies. Data collected included production volume, number of defective products, and defect types identified through visual inspection using a check sheet. The data were analyzed using defect-rate calculations, Pareto analysis, and Statistical Process Control (SPC) using a p-chart. A total of 99 defective products were identified, corresponding to an overall defect rate of 4.66%, while the first-pass conformity rate was 95.34%. Pareto analysis identified shape nonconformity as the dominant defect, accounting for 45.45% of total defects, followed by topping damage (17.18%), color non-uniformity (14.14%), poor dough cohesion (13.13%), and structural breakage (10.10%). The three most frequent defect types accounted for 76.77% of all defects. The p-chart showed that the four observed batch proportions were within the calculated control limits (UCL = 7.40%; LCL = 1.92%). However, because only four production batches were observed, these control-chart results should be interpreted as an initial indication of process variability rather than definitive evidence of long-term statistical control. The findings indicate that shape nonconformity is the primary quality-improvement priority, while further monitoring using a larger number of production batches is required to establish reliable process-control limits and investigate the underlying causes of defects.
1.Introduction
Quality food products are a key factor in the food industry. In recent decades, consumer interest and demand for better food quality, safety, authenticity, traceability, and sustainability have created a competitive food industry environment [1], [2]. Food products with guaranteed quality will increase consumer satisfaction. In the modern era, consumers tend to choose food products whose safety can be validated and traced [3]. In addition, safe food products will increase their economic value and competitiveness. This can ensure the sustainability of a business, especially for entrepreneurs who are just starting to market their products [4].
The presence of product defects, whether physical, chemical, or microbiological, can certainly reduce the product's selling value. Products with chemical and microbiological defects can have fatal impacts on consumer health [5], [6]. Physical defects in food products are not something to be taken lightly. Starting from physical defects, they can cause chemical and microbiological effects. For example, broken cookies increase the surface area, thereby increasing the risk of fat oxidation in the cookies [7]. Damage to food products can clearly cause economic losses for producers [8], [9]. Furthermore, increased food waste is also one of the consequences of food damage [10]–[12].
Small and medium-scale food producers still face challenges in controlling the quality of their products [1]. Typically, small and medium-scale producers lack a structured quality control system. This can be due to a lack of and limited human resources [13], [14]. Furthermore, the wide variety of products also makes it difficult to control them. Manual and visual inspection remains common in small-scale food production, but without systematic recording and analysis, recurring defects and variations between production batches may be difficult to identify. Statistical Quality Control (SQC) provides a data-based approach for monitoring product quality and identifying the most important sources of nonconformity. Among the basic quality tools, check sheets can be used to systematically record defects, Pareto analysis can be used to prioritize the most frequent defect categories, and control charts can be used to examine process variation over time [13], [15], [16].
The almond tree (Prunus dulcis), a member of the Rosaceae family, has attracted significant attention due to its numerous uses [17]. The almond tree is cultivated primarily for its nuts, which contain 4% water, 22% carbohydrates, 21% protein, and 50% fat, with a high monounsaturated fatty acid content (39%) and low saturated fatty acid content (3.7%) [18], [19]. In addition, almonds are a valuable source of minerals such as calcium, copper, iron, magnesium, manganese, phosphorus, and zinc [20], [21]. Due to their diverse nutritional value, almonds can be consumed raw but are also used for the production of almond milk and other food products [22], [23]. Almond cookies are a bakery product based on almond powder, characterized by a crispy texture and a uniform texture. During the production process, various defects can occur, such as uneven shapes, broken products, damaged toppings, uneven color, and an unsatisfactory texture. These defects can reduce consumer acceptance and the quality of the final product.
The food industry is required to produce consistent, safe, and quality-compliant products to meet consumer expectations and enhance business competitiveness. Variability in raw materials, processing, and production conditions can lead to defective products, which can impact quality, production efficiency, and increase food waste [24], [25]. Therefore, implementing effective quality control is a crucial aspect of modern food production systems. One widely used approach is Statistical Quality Control (SQC), a statistical method used to continuously monitor, control, and evaluate the quality of production processes [13], [15]. Implementing SQC enables companies to identify sources of process variation and reduce the level of non-conforming products, thereby minimizing the risk of quality failure. In its implementation, the Pareto diagram is used to identify the most dominant types of defects so that corrective actions can be focused on issues that contribute the most to the total number of defects. Furthermore, control charts, particularly p-charts, are widely used to monitor the proportion of defective products and evaluate whether the production process is in statistical control or experiencing deviations that require corrective action [16]. This approach has proven to be an effective tool in the food industry quality control system because it can support data-driven decision-making, improve process efficiency, and reduce defective products that have the potential to cause economic losses.
Several previous studies have applied SQC to bakery products, chocolate, chips, and other food products. However, research on quality control in almond cookies, especially in small and medium-scale food industries, is still limited. However, studies reporting the dominant defect types and process stability of almond cookie production, particularly in small-scale food industries, remain limited. Therefore, this study aims to analyze the defect level of almond cookies produced by small industries in Yogyakarta using a Statistical Quality Control approach. The analysis was carried out by identifying product defect types, calculating production yields, preparing a Pareto diagram to determine dominant defects, and evaluating the stability of the production process using a p-chart.
2.Method
2.1.Study Design
This study used a descriptive observational method with a SQC approach. Observations were conducted on Almond Cookies products produced by a small-scale producer in Yogyakarta during four production batches. Data collected included production volume, number of defective products, and type of product defects. The data were then analyzed using check sheets, production yield calculations, Pareto diagrams, and p-charts to evaluate defect characteristics and production process stability.
The data in this study were obtained through direct observation of the production process, visual inspection of finished products, and recording the number of defective products based on the type of defect using an observation sheet (check sheet). The main variables observed included the number of products produced per batch, the number of defective products per batch, the percentage of defects per batch, the type of product defects (shape nonconformity, topping damage, color non-uniformity, poor dough cohesion, and structural breakage), and production yield.
This study analyzed only four production batches because the observations were conducted during the internship period. Therefore, the p-chart should be interpreted as an initial evaluation of process variability rather than definitive evidence of long-term statistical control.
2.2.Study Object
The research object consisted of almond cookies produced in four production batches by a small-scale food producer in Yogyakarta. The total number of cookies produced during the observation period was 2,125 pieces, consisting of 534 pieces in batch 1, 546 pieces in batch 2, 524 pieces in batch 3, and 521 pieces in batch 4. Each cookie was visually inspected after production to determine whether it conformed to the established product specifications and to classify any observed defect according to the predefined defect categories.
2.3.Data Analysis
Observation data were analyzed using a step-by-step Statistical Quality Control (SQC) approach to evaluate the quality of almond cookies [26]. The first step involved compiling a check sheet to summarize the number of products produced, the number of defective products, and the types of defects found in each production batch. This data was then used to calculate the percentage of defects and production yield as indicators of process efficiency. The yield value was calculated based on the comparison between the number of products that met quality specifications to the total number of products produced (equation (1)) [27]. Next, the frequency data for each type of defect was analyzed using a Pareto Diagram to identify the type of defect that contributed the most to the total number of product defects so that process improvement priorities could be determined [28]. The next step was a Statistical Process Control (SPC) analysis using a p-chart [29] to evaluate the stability of the production process based on the proportion of defective products in each batch ($p_i$) (equation (2)). The p-chart was constructed by calculating the center line (equation (3)), average sampel size (equation (4)), standard deviation p-chart (equation (5)), upper control limit (UCL) (equation (6)), and lower control limit (LCL) (equation (7)) to determine whether the production process was indicated no observations outside the calculated control limits conditions or if there were deviations requiring corrective action. The results of this analysis were used as a basis for evaluating production process performance and formulating recommendations for quality improvement in almond cookies.
Where $p_i$ was proportion of defects per batch, $d_i$ was number of defects per batch, $n_i$ was number of total productions per batch, $\bar{p}$ was the center line, $\bar{n}$ was average sampel size, and $\sigma_p$ was standard deviation p-chart.
3.Results and Discussion
3.1.Reject Level per Batch of Almond Cookies
Based on Table 1, observations on the quality of almond cookies were conducted on four production batches with a total production of 2,125 pieces. The number of defective products during the observation period reached 99 pieces or 4.66% of the total production. The percentage of defects in each batch showed variation, namely 3.75% in batch 1, 6.23% in batch 2, 3.63% in batch 3, and 4.99% in batch 4. Batch 2 had the highest defect rate compared to the other batches, while batch 1 showed the lowest defect rate. The difference in the percentage of defects between batches indicates variations in the production process that can be influenced by raw material factors, work methods, equipment conditions, and operator skills [13], [24], [30]. However, in general the defect rate obtained was still below 10%, so that most of the products produced met the established quality specifications. These observations indicate that the almond cookies production process has a fairly high level of product acceptance, but quality control efforts are still needed to reduce the number of defective products and increase production efficiency.
The data in Table 1 is then used to calculate production yield, identify dominant defect types using a Pareto Diagram, and evaluate the stability of the production process using a p-chart.
| Batch | Total production (pieces) | Frequency of almond cookies reject (pieces) | Total defect per batch (piece) | Defect percentage (%) | ||||
|---|---|---|---|---|---|---|---|---|
| Structural breakage | Shape nonconformity | Color non-uniformity | Topping damage | Poor dough cohesion | ||||
| 1 | 534 | 2 | 7 | 11 | 0 | 0 | 20 | 3.75 |
| 2 | 546 | 3 | 23 | 0 | 3 | 5 | 34 | 6.23 |
| 3 | 524 | 3 | 8 | 2 | 2 | 4 | 19 | 3.63 |
| 4 | 521 | 2 | 7 | 1 | 12 | 4 | 26 | 4.99 |
| Total | 2,125 | 10 | 45 | 14 | 17 | 13 | 99 | 4.66 |
The calculation results show that the total production of almond cookies during the four observed batches reached 2,125 pieces, with 100 defective products (Table 1). Based on this data, the percentage of conforming products reached 95.34%, indicating that most of the products produced met the established quality specifications. This value indicates that the majority of the observed cookies did not show the recorded visual defects. However, because the first-pass conformity rate is mathematically derived from the defect rate, it should not be interpreted as a separate production-yield analysis. The main quality indicator in this study is therefore the observed defect rate and its distribution among defect categories.
Differences in defect rates between production batches may reflect variation in processing conditions, material characteristics, handling, or operator practices. However, the present study did not collect sufficient causal data to determine which specific factor was responsible for the variation. Therefore, these factors should be regarded as potential areas for subsequent investigation rather than established causes of the observed defects.
3.2.Pareto Diagram of Almond Cookies
The results of the Pareto analysis illustrate in Table 2 and Fig. 1. Of the total 99 defective products identified, product shape nonconformity was the most dominant type of defect with a frequency of 45 units or 45.45% of the total defects. The next defects were topping damage of 17 units (17.18%), color non-uniformity of 14 units (14.14%), poor dough cohesion of 13 units (13.13%), and structural breakage of 10 units (10.10%). These results indicate that almost half of the total product defects were caused by product shape mismatch so that this aspect became the main priority in quality improvement efforts.
| Reject type | Reject frequency (piece) | Reject percentage (%) | Cumulative percentage (%) |
|---|---|---|---|
| Shape nonconformity | 45 | 45.45 | 45.45 |
| Topping damage | 17 | 17.18 | 62.63 |
| Color non-uniformity | 14 | 14.14 | 76.77 |
| Poor dough cohesion | 13 | 13.13 | 89.90 |
| Structural breakage | 10 | 10.10 | 100.00 |

Based on the Pareto 80/20 principle, most quality problems are generally caused by a small number of dominant factors. In this study, the three types of defects with the highest frequency namely product shape discrepancy, topping damage, and color inhomogeneity, cumulatively contributed approximately 76.77% of the total product defects. The dominant contribution of shape nonconformity suggests that the molding stage and dough characteristics warrant further investigation. Nevertheless, the present study did not collect direct process measurements or conduct a formal root-cause analysis. Therefore, the possible relationship between shape nonconformity and molding consistency, dough characteristics, operator technique, or equipment condition should be considered a hypothesis rather than a demonstrated causal relationship. Similarly, topping damage and color non-uniformity may be associated with topping application, dough or ingredient mixing, baking, or handling, but these potential causes require verification through direct observation and a structured cause-and-effect or 5-why analysis.
Accordingly, the Pareto result provides a clear prioritization of quality problems, while the identification of their actual root causes should be addressed in a subsequent improvement study. A cause-and-effect diagram involving the production operators and supervisors would be particularly useful for investigating the three dominant defects and translating the Pareto findings into specific corrective actions.
3.3.Statistical Process Control of Almond Cookies using p-Chart
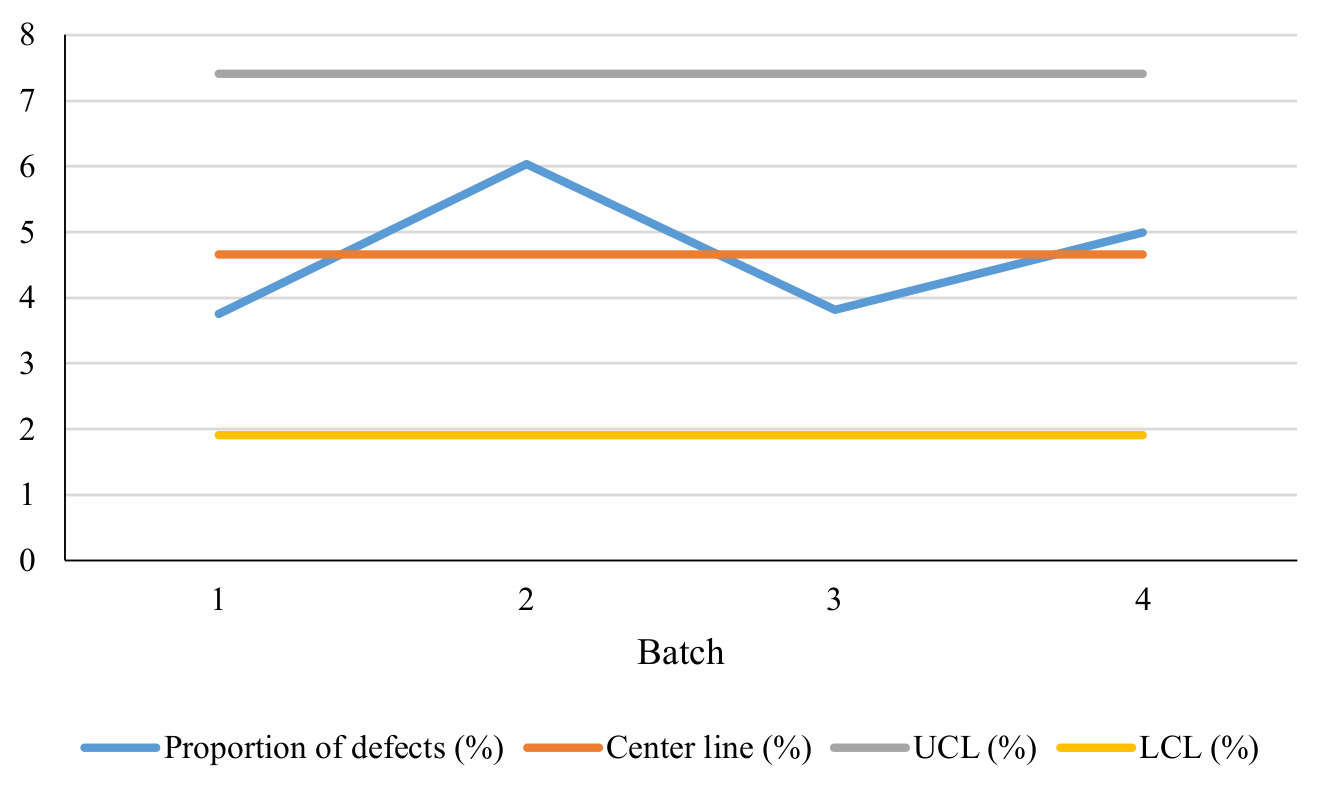
SPC analysis using p-chart in Table 3 was conducted to evaluate the stability of the almond cookies production process based on the proportion of defective products in each production batch. The calculation results showed that the proportion of defects in batch 1, batch 2, batch 3, and batch 4 were 0.0375; 0.0623; 0.0363; and 0.0499, respectively. The center line value obtained was 0.0466 or 4.66%, which indicates the average proportion of defects during the observation period. Meanwhile, the UCL and LCL were 0.0740 and 0.0192, respectively. These results indicate that all values of the proportion of defects were between the upper and lower control limits, so that no observation points were found outside the statistical control limits. This condition indicates that the variation in defects that occurred was still a common cause variation originating from the production system and not a special cause variation. Thus, the almond cookies production process can be indicated no observations outside the calculated control limits condition.
| Batch | Total production (pieces) | Total defect per batch (piece) | Proportion of defects (%) | Center line (%) | Average sampel size | Standard deviation | UCL (%) | LCL (%) |
|---|---|---|---|---|---|---|---|---|
| 1 | 534 | 20 | 3.75 | 4.66 | 531.25 | 0.00914 | 7.40 | 1.92 |
| 2 | 546 | 34 | 6.23 | |||||
| 3 | 524 | 19 | 3.63 | |||||
| 4 | 521 | 26 | 4.99 | |||||
| Total | 2,125 | 100 | 4.66 |
Although the production process was under statistical control, the average defect rate of 4.66% still indicated opportunities for quality improvement. Batch 2 had the highest defect rate at 6.04%, although this value was still below the upper control limit. This condition indicates that there was an increase in the number of defective products in that batch, which requires further attention. In contrast, batches 1 and 3 showed relatively low defect rates, at 3.75% and 3.63%, respectively. Variations in the defect rate between batches can be influenced by production factors such as dough mixing consistency, the molding process, topping placement, and operator skills during the production process. Therefore, even though no significant process deviations were found, continuous improvement efforts are still needed to reduce the defect rate and increase production efficiency. Even though the production process remains under statistical control, identifying the dominant defect types is still necessary to prioritize quality improvement actions. Therefore, a Pareto Chart analysis is used to identify the defect types that contribute the most to the total product defects.
Fig. 2 explains that based on the p-chart compiled from the proportion of defects in four production batches, all observation points are between the upper control limit (UCL = 7.40%) and the lower control limit (LCL = 1.92%). There are no points outside the control limits, so the almond cookies production process can be indicated no observations outside the calculated control limits condition. However, variations in the proportion of defects between batches were still found, with the highest defect rate occurring in batch 2 at 6.23%. Nevertheless, because the chart was constructed from only four production batches, the figure should be interpreted as an initial visualization of observed batch-to-batch variability rather than conclusive evidence of long-term statistical control. Continued monitoring over a larger number of production batches is recommended before establishing definitive baseline control limits for routine process monitoring.
4.Conclusion
The application of Statistical Quality Control successfully identified the quality characteristics and process stability of almond cookies production. A total of 99 defective products were recorded from 2,125 products produced, resulting in a defect rate of 4.66% and a production yield of 95.34%. Pareto analysis showed that shape nonconformity, topping damage, and color non-uniformity were the dominant defects, contributing 76.77% of the total defects and therefore requiring priority corrective actions. Furthermore, the p-chart analysis indicated that all observed defect proportions remained within the established control limits, demonstrating that the production process was statistically under control and that defect variations originated primarily from common causes. Although the process exhibited acceptable stability and a relatively high yield, continuous quality improvement focusing on the dominant defects is recommended to further reduce product losses and improve production efficiency.
Author Contribution: All authors contributed equally to the main contributor to this paper. All authors read and approved the final paper.
Conflicts of Interest: The authors declare no conflict of interest.